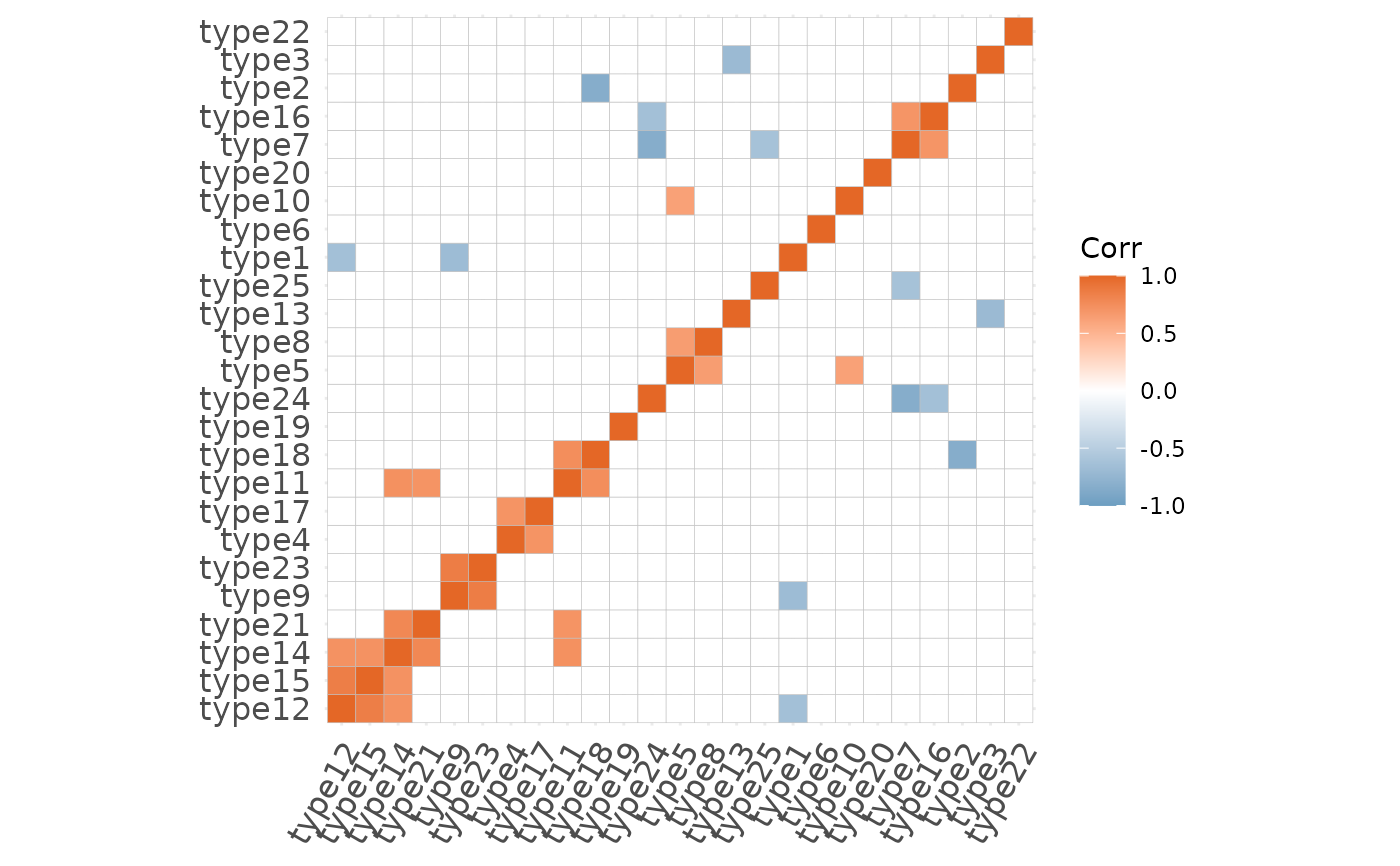
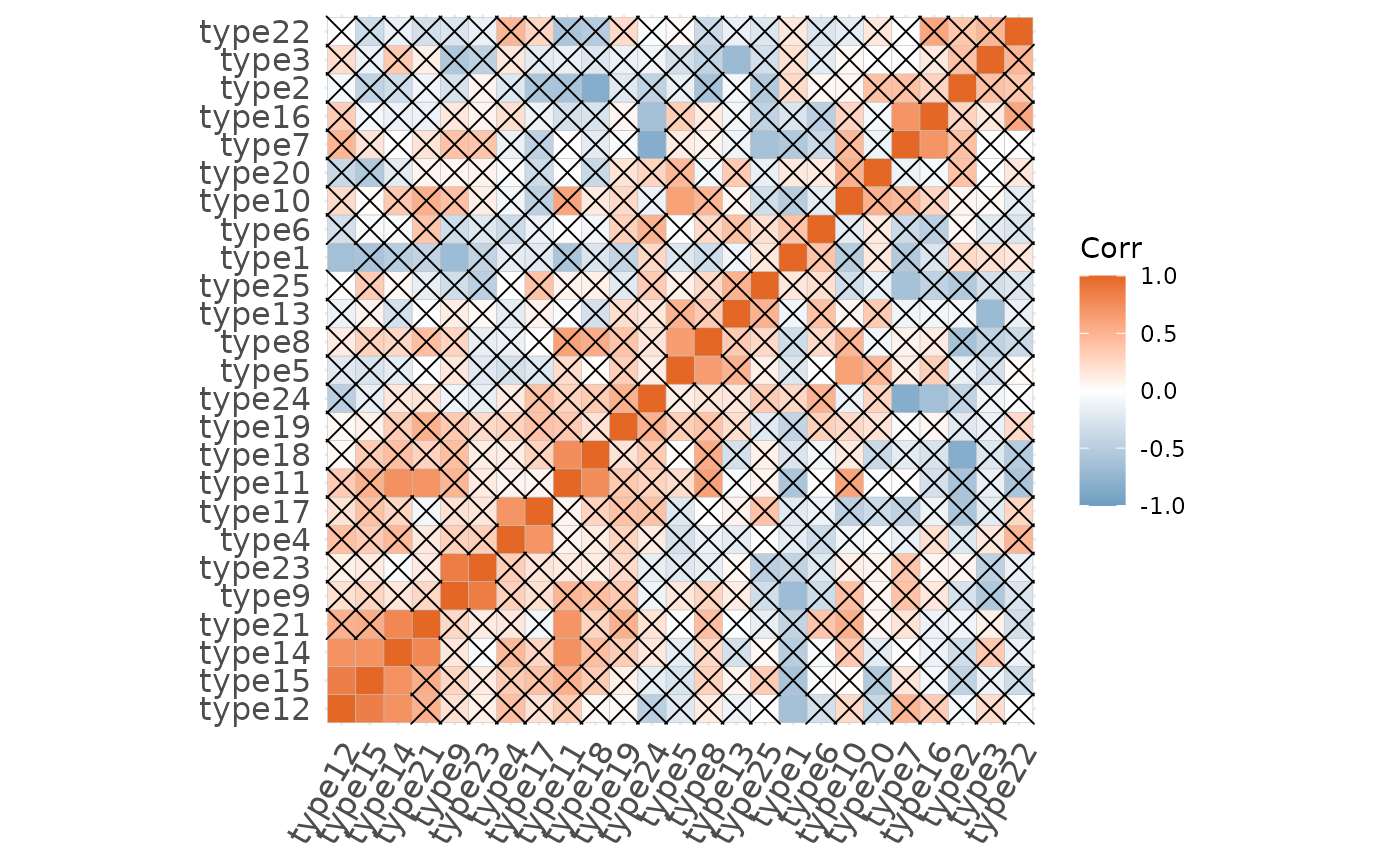
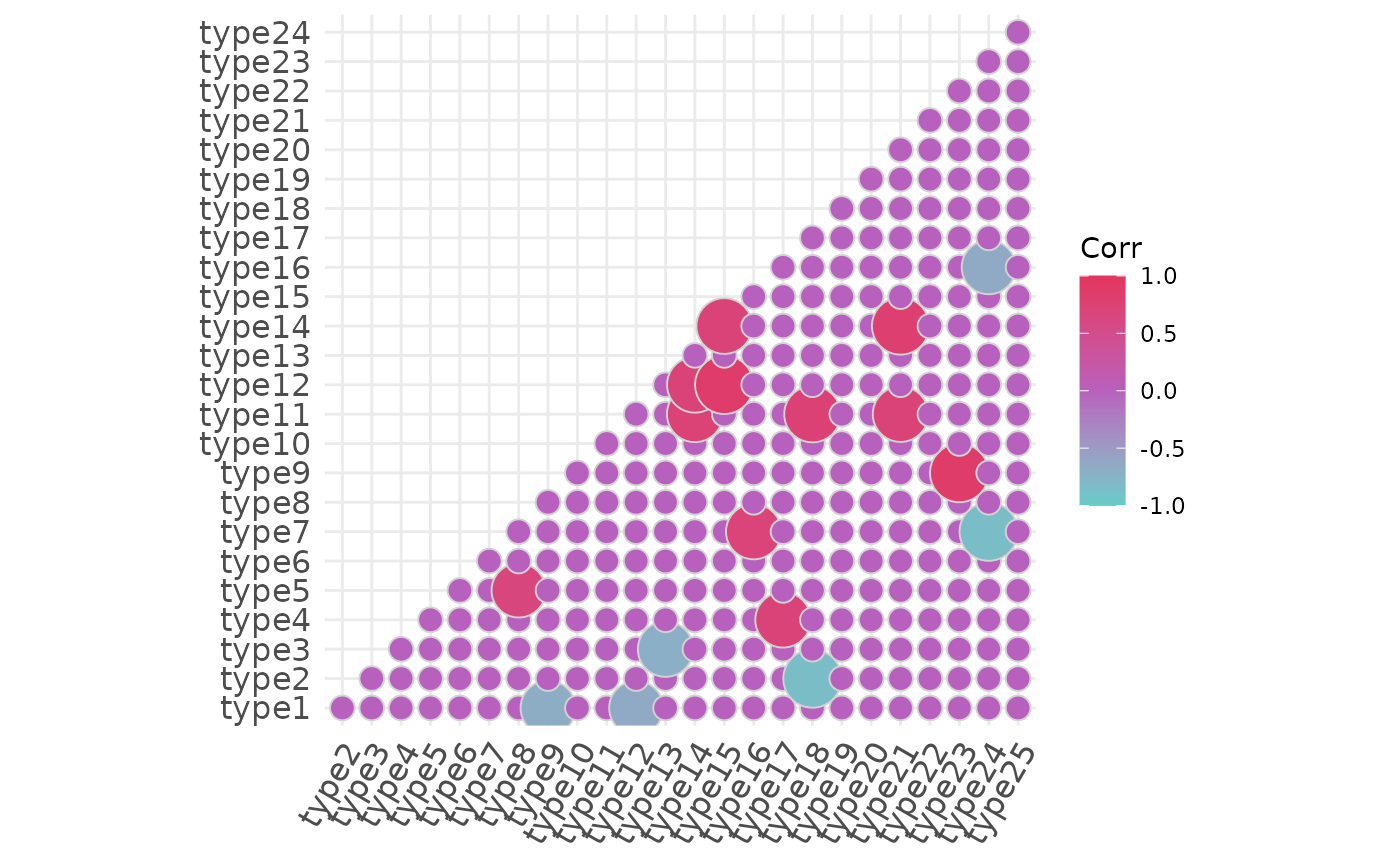
This function takes in a matrix with the predicted proportions for each spot and returns a correlation matrix between cell types.
Arguments
- x
numeric matrix with rows = samples and columns = cell types Must have at least two rows and two columns.
- cor.method
Method to use for correlation: c("pearson", "kendall", "spearman"). By default pearson.
- insig
character, specialized insignificant correlation coefficients, "pch", "blank" (default). If "blank", wipe away the corresponding glyphs; if "pch", add characters (see pch for details) on corresponding glyphs.
- colors
character vector with three colors indicating the lower, mid, and high color. By default c("#6D9EC1", "white", "#E46726").
- hc.order
logical value. If TRUE, correlation matrix will be hc.ordered using hclust function.
- p.mat
logical value. If TRUE (default), correlation significance will be used. If FALSE arguments sig.level, insig, pch, pch.col, pch.cex are invalid.
- ...
additional graphical parameters passed to
ggcorrplot.
Examples
set.seed(321)
x <- replicate(m <- 25, runif(10, 0, 1))
rownames(x) <- paste0("spot", seq_len(nrow(x)))
colnames(x) <- paste0("type", seq_len(ncol(x)))

# The most basic example
plotCorrelationMatrix(x = x)


# Showing the non-significant correlatinos
plotCorrelationMatrix(x = x, insig = "pch")


# A more elaborated
plotCorrelationMatrix(
    x = x,
    hc.order = FALSE,
    type = "lower",
    outline.col = "lightgrey",
    method = "circle",
    colors = c("#64ccc9", "#b860bd", "#e3345d"))
#> Warning: `guides(<scale> = FALSE)` is deprecated. Please use `guides(<scale> = "none")` instead.
