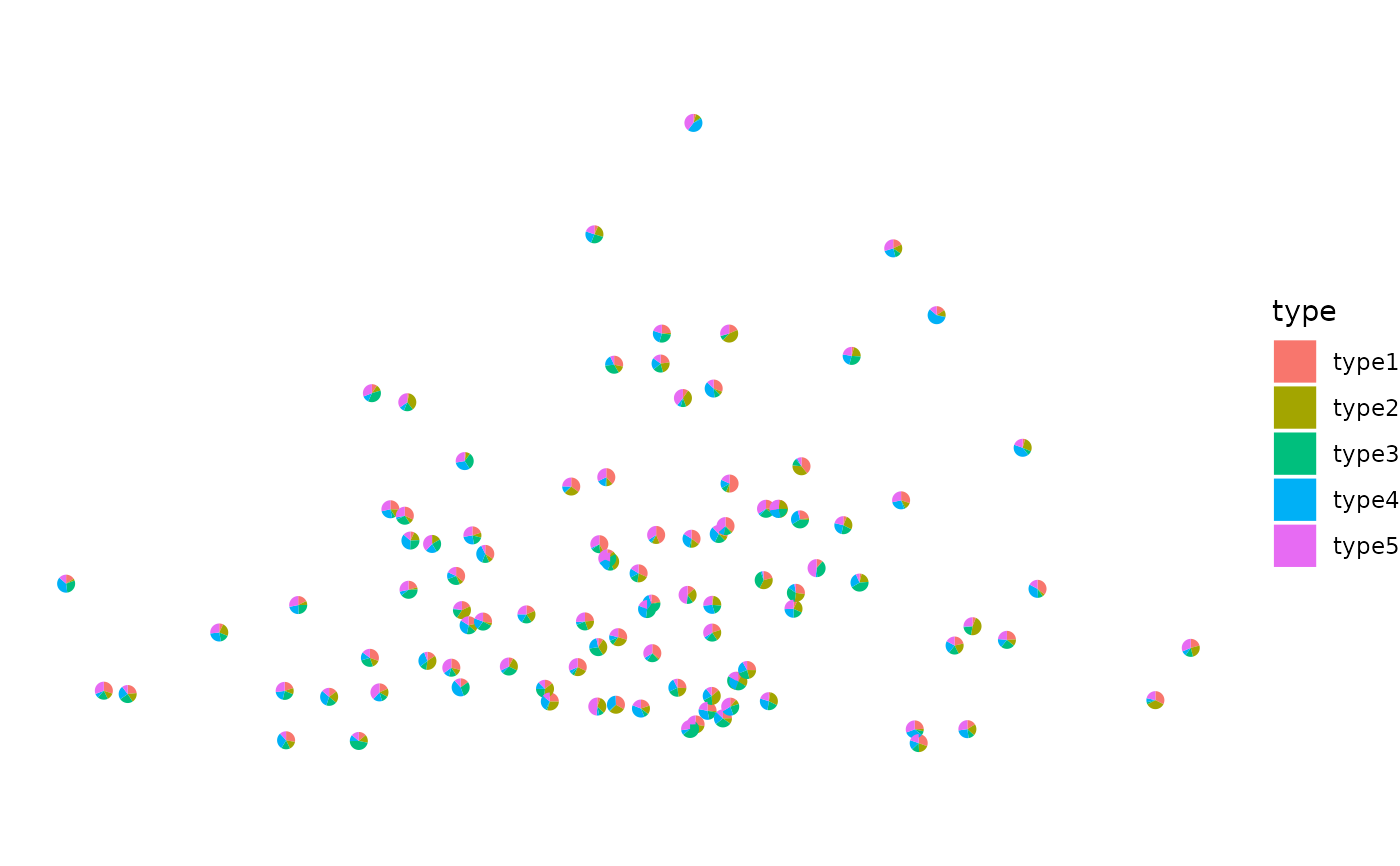
This function takes in the coordinates of the spots and the proportions of the cell types within each spot. It returns a plot where each spot is a piechart showing proportions of the cell type composition.
Usage
# S4 method for matrix,matrix
plotSpatialScatterpie(
  x,
  y,
  ...,
  cell_types = colnames(y),
  img = FALSE,
  scatterpie_alpha = 1,
  pie_scale = 0.4
)

# S4 method for Seurat,ANY
plotSpatialScatterpie(x, y, ..., slice = Images(x)[1], img = FALSE)

# S4 method for SpatialExperiment,ANY
plotSpatialScatterpie(
  x,
  y,
  ...,
  slice = imgData(x)[1, "sample_id"],
  img = FALSE
)

# S4 method for data.frame,ANY
plotSpatialScatterpie(x, y, ...)

# S4 method for ANY,data.frame
plotSpatialScatterpie(x, y, ...)

# S4 method for ANY,ANY
plotSpatialScatterpie(x, y, ...)
Arguments
- x
Object containig the spots coordinates, it can be an object of class SpatialExperiment, Seurat, dataframe or matrix. For the latter two rownames should have the spot barcodes to match x.
- y
Matrix or dataframe containing the deconvoluted spots. rownames hould have the spot barcodes to match x.
- ...
additional parameters to geom_scatterpie
- cell_types
Vector of cell type names to plot. By default uses the column names of y.
- img
Logical TRUE or FALSE indicating whether to plot the image or not. Objects of classes accepted by
plotImagecan also be passed and that image will be used. By default FALSE.- scatterpie_alpha
Numeric scalar to set the alpha of the pie charts. By default 1.
- pie_scale
Numeric scalar to set the size of the pie charts. By default 0.4.
- slice
Character string indicating which slice to plot if img is TRUE. By default uses the first image.
Examples
set.seed(321)

# Coordinates
x <- replicate(2, rnorm(100))
rownames(x) <- paste0("spot", seq_len(nrow(x)))
colnames(x) <- c("imagecol", "imagerow")

# Proportions
y <- replicate(m <- 5, runif(nrow(x), 0, 1))
y <- prop.table(y, 1)

rownames(y) <- paste0("spot", seq_len(nrow(y)))
colnames(y) <- paste0("type", seq_len(ncol(y)))

(plt <- plotSpatialScatterpie(x = x, y = y))